alrummah valley includes work that i've created surrounding time, space, and my own personality and explorations.

alrummah valley includes work that i've created surrounding time, space, and my own personality and explorations.
Refresh this page to find three hours of my life.
Most of the HTML, CSS, javascript, and python code involved in constructing this page was initialized by ChatGPT.
Plenty of it was then processed, edited, or otherwise altered manually. But plenty of it wasn't, too. Call it code curation.
This has enabled the development of much more robust and creative programming work that otherwise wouldn’t have been otherwise possible in such a short timeframe.
For reference, the "Concrete Poetry" application featured below was the most technically advanced web development project I was able to complete last summer ... those halcyon pre-GPT days.
These are the results of an exploratory exercise into the expansive spatial data archive the Federal Communications Commission maintains in their open data portal.
In addition to transmitter locations, the FCC hosts a .txt database of estimated propagation curves that is updated daily based on local weather conditions. By superimposing these curves on aerial imagery, one can note the effect of terrain on radio propagation.
These embedded animations are a subset (n=178) of the 27,104 FM transmitters and relays registered with the FCC. Imagery is scraped from the Bing Maps API based on transmitter coordinates (Zoom Level 15) and total extent of each propagation curve surrounding the transmitter (Estimated Propagation Area).
Imagery was processed using Floyd-Steinberg dithering in python image library to optimize for web view before assembling into GIFs.
A geographic radio receiver.
This application enables a user to survey an audio landscape constructed by scraped internet radio "transmissions" tethered to the geographic coordinates of their host stations.
The interpolated spaces between these discrete coordinates create alternative boundary regions constructed by radio and its attendant cultural affinities rather than the (often violently drawn) lines found on a political map.
Pictured: Baja California to the Gulf of Mexico
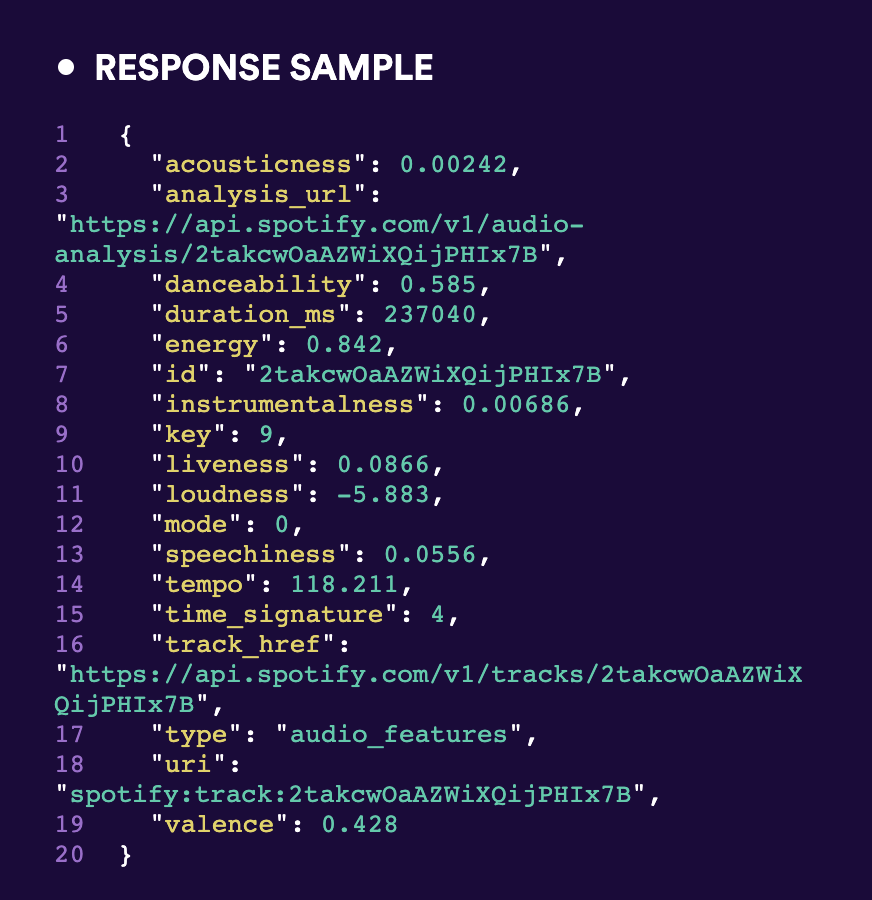
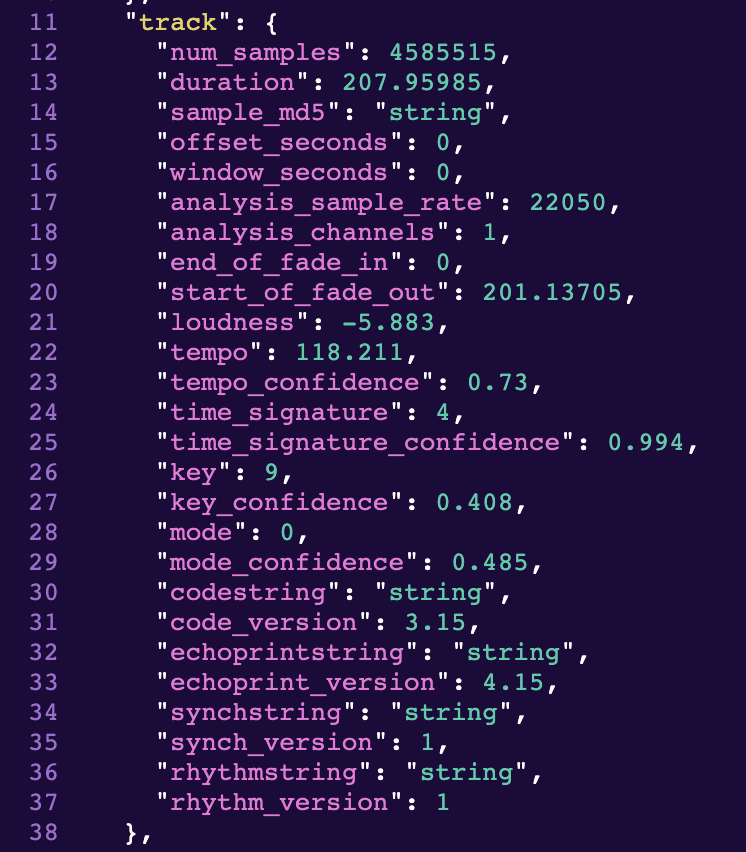
Spotify for Developers (not to be confused with Spotify for Artists, their insecurity-exploiting analytics branch) opens the hood up a little on their metadata scheme.
New music reaches listeners by way of a web of audio analysis and prediction algorithms, ostensibly irrespective of geography.
This is a "patch" [script] written in Max/MSP, a visual coding language that is great for bridging audio inside and outside the computer.
The goal of this patch was to capture some of the thousands of miniature events that take place while using a computer during a typical workday and recontextualize those events into an audio piece - in this case a remix of Terry Riley’s 1968 minimalist piece "In C".
Keypresses, mouse downs, and microphone transients trigger a count. The frequency of these events defines an environmental energy level. At certain thresholds, audio content and quality changes, sequencing the remix.

CLICK HERE TO LISTEN TO A SAMPLE!
Users input bits of conversation they come across on the streets of the city, as well as the approximate location it took place, then submit the form. The resulting map presents the candid character of a neighborhood or borough.
Each submission is also streamed into a sidebar that builds a growing poem of New York as a whole.
see you later!
